I-5 between San Diego and North County: when to go north, when to go south
Go north before 2pm or after 7pm. I-5 northbound jams most weekday afternoons from Carmel Valley through Solana Beach, the county's #2 bottleneck. Southbound, afternoon slowdowns sit at Oceanside, Clairemont, SeaWorld Drive and downtown.
- Worst I-5 jam
- NB at Lomas Santa Fe
- Days slow
- 170
- Longest SB queue
- 8 miles
- Morning bottlenecks on I-5
- 0
#2 in the county, 2024
6.6-mile average queue
Toward SeaWorld Dr
In the 2024 top 20
The short version
- I-5 northbound at Lomas Santa Fe Drive is Caltrans' #2 bottleneck: slow on 170 days in 2024 with a 6.6-mile queue
- Two more northbound afternoon jams sit just south of it, at Carmel Valley Road and north of Via de la Valle
- Southbound, I-5 slows in the afternoon at Oceanside Blvd, Clairemont Drive, SeaWorld Drive (8-mile queue), downtown and National City
- None of I-5's top-20 bottlenecks is a morning jam
- The carpool lanes now run from the I-5/I-805 merge to SR-78; tolled express lanes are planned but have no opening date
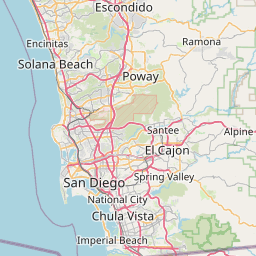
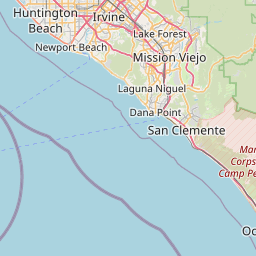
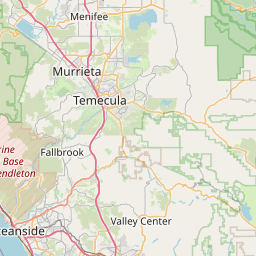
I-5 is the coast's only freeway, and its worst stretch is a short one: the few miles north of the I-5/I-805 merge, through Carmel Valley, Del Mar and Solana Beach. That's where the commuters from Sorrento Valley, UTC and downtown funnel north in the afternoon. The map shows every I-5 stretch in Caltrans' 2024 list of the county's 20 worst bottlenecks, plus SR-56, which feeds it.
Northbound from Carmel Valley to Solana Beach is the worst of it. Going north? Leave before 2pm or after 7pm.





Slow · weekday afternoons (10)
Solid lines are Caltrans' 2024 top-20 bottlenecks, drawn along the real freeway lanes and cut to the average queue length Caltrans reports. The dashed line to the border is Mexico-bound traffic, which Caltrans doesn't rank; it's drawn from border-wait reporting, not sensor data.
Going north: the Del Mar squeeze
Three of the county's 20 worst bottlenecks are northbound I-5 in the afternoon, a few miles apart: Carmel Valley Road (#12, 227 days slow, 3.2-mile queue), north of Via de la Valle (#18, 134 days) and Lomas Santa Fe Drive in Solana Beach (#2, 170 days, 6.6-mile queue, 592,440 vehicle-hours of delay). SR-56 eastbound at Carmel Country Road (#16, 240 days) backs up in the same window. In April to June 2025 Lomas Santa Fe was #3 in the county.
Going south: five separate slow spots
Southbound has no single monster jam but more of them: Oceanside Boulevard (#15), south of Clairemont Drive (#10, 6.2-mile queue), SeaWorld Drive (#19, the longest average queue on the list at about 8 miles), 5th Avenue downtown (#4, slow on 239 days) and north of 8th Street in National City (#17). All are afternoon jams. Past National City, Caltrans' ranking stops, but the road doesn't get better: from Chula Vista to San Ysidro, Mexico-bound traffic fills I-5 in the afternoon (dashed on the map). See what the ranking misses.
I-5 in the afternoon, by direction
| Northbound | Southbound | |
|---|---|---|
| Top-20 bottlenecks | 3 | 5 |
| Worst one | Lomas Santa Fe Dr (#2) | 5th Ave downtown (#4) |
| Where it hurts | Carmel Valley to Solana Beach | Oceanside, Clairemont, SeaWorld Dr, downtown, National City |
| Morning bottlenecks | None | None |
When to go
Timing an I-5 drive
- 01
Northbound in the afternoon: before 2pm or after 7pm
Citywide, TomTom's 2025 data has a 10 km drive taking about 11½ minutes at 2pm midweek, 15½ at 4pm and under 11 at 7pm. The Del Mar bottlenecks follow the same clock.
- 02
Mornings are your friend
No I-5 stretch made Caltrans' top 20 as a morning jam, and morning-peak delay countywide fell 25.7% in spring 2025 compared with a year earlier.
- 03
Friday: go early
Friday's afternoon rush starts at 2pm and peaks at 3pm citywide, an hour earlier than Tuesday to Thursday.
- 04
Or skip it
The Coaster runs the same coast from Oceanside to downtown. See Coaster or Amtrak.
KEEP READING
SOURCES
Everything above traces back to one of these. Follow them — if one has changed and we haven't, that's our mistake, not yours.
- PrimaryCaltrans District 11 Mobility Performance Report, Q2 2025 (bottleneck tables for 2024 and Q2 2025)
Caltrans District 11 · Published May 2025; latest edition found October 19, 2026
Bottleneck locations, direction, days active, queue length and vehicle-hours of delay, from PeMS freeway sensors
SANDAG · Checked October 19, 2026
Carpool lane opening years and the express-lane plan
TomTom · Checked October 19, 2026
Hour-by-day travel times, rush-hour congestion and speeds
OpenStreetMap contributors
Map lines trace the real carriageway, cut to the queue length Caltrans reports